Carbon footprints, flowers and climate change
Everything has a carbon footprint: things, people and countries — and flowers. Understanding how carbon footprints are measured and what gives rise to these footprints is at the heart of tackling climate change.
Facts and snacks
We all know what it is like to crave something sweet. It can strike mid-morning after a few hours of physical work, or after dinner when the day won’t feel complete until something treaty has passed your lips.
So, you move to the fridge. There are some apples that you know will keep your doctor happy. Then there is the shiny chocolate wrapper in the door that catches your eye, winks and guarantees a mouthful of superior deliciousness.
At some point in your life, you learnt that the apple and the chocolate bar are made of different things. You know the apple is not only more nutritious, but also has fewer calories. In fact, for the same weight, chocolate has 10 times the energy of apples because it is dense with high-calorie fat and sugar, whereas much of the apple is zero-calorie water.

Becoming familiar with the concept of carbon foot-printing is much like getting used to estimating the energy value of certain foods. It is an understanding that, once grasped, has ongoing application and value in many areas of your life. With a basic understanding of nutrition, you can make good choices about what you eat and maintain a healthy body. Likewise, with an understanding of carbon foot-printing, you can make choices that can maintain a healthy planet.
A ‘carbon footprint’ is simply a measure
Like ‘calories’ the word ‘carbon footprint’ is a measure. Basically, it is a measure of how much something contributes to climate change. Too much chocolate, and we gain weight. Likewise, if our carbon footprint is too high, we make an unsustainable contribution to the problem of climate change.
More specifically, a carbon footprint measures the amount of greenhouse gases something adds to the atmosphere.
As we know, burning fossil fuels for energy and transport transfers carbon that was locked up in the earth into the atmosphere as carbon dioxide. The balance of gasses in the atmosphere is now out of whack – which is impacting the climate.
Carbon dioxide (or CO2) is not the only greenhouse gas contributing to global warming, but it is by far the most abundant. For that reason, we tend to use ‘carbon’ as shorthand for all greenhouse gases. However, ‘carbon footprint’ usually means ‘greenhouse gas footprint’, and includes all the gases that contribute to the greenhouse effect, like methane and nitrous oxide.
For example, agriculture and landfill both increase methane in the atmosphere. So activities like eating a meat-heavy diet or not sorting waste correctly also increase our carbon footprint.
The carbon footprint of things
Everything has a carbon footprint: things, people and countries.
For example, we can calculate the carbon footprint of an apple. To do this, we include all the greenhouse gas emissions that come from preparing for planting, growing and harvesting.
Unlike an apple, a chocolate bar has many ingredients. To calculate its carbon footprint, we’d need to measure the emissions of all the individual ingredients, including the sugar, the cocoa and the milk.
For both products, we would also need to add emissions from packaging, refrigeration, transport and distribution, as well as how the product was used and disposed of.

What contributes to the carbon footprint of an apple.
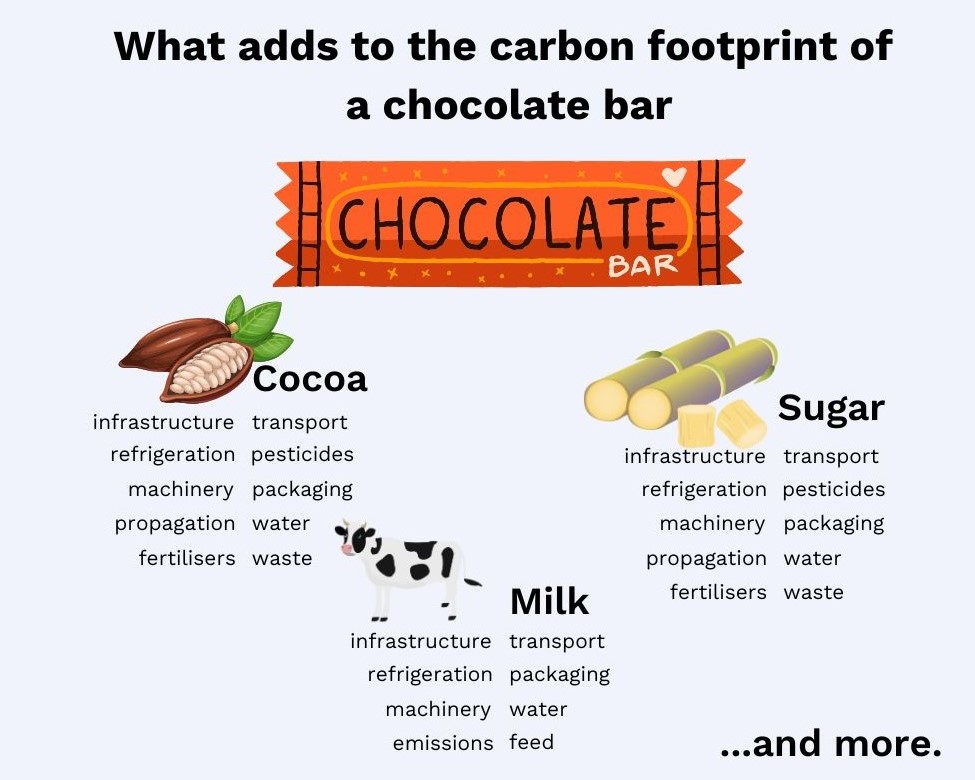
What contributes to the carbon footprint of a chocolate bar.
The carbon footprint of flowers
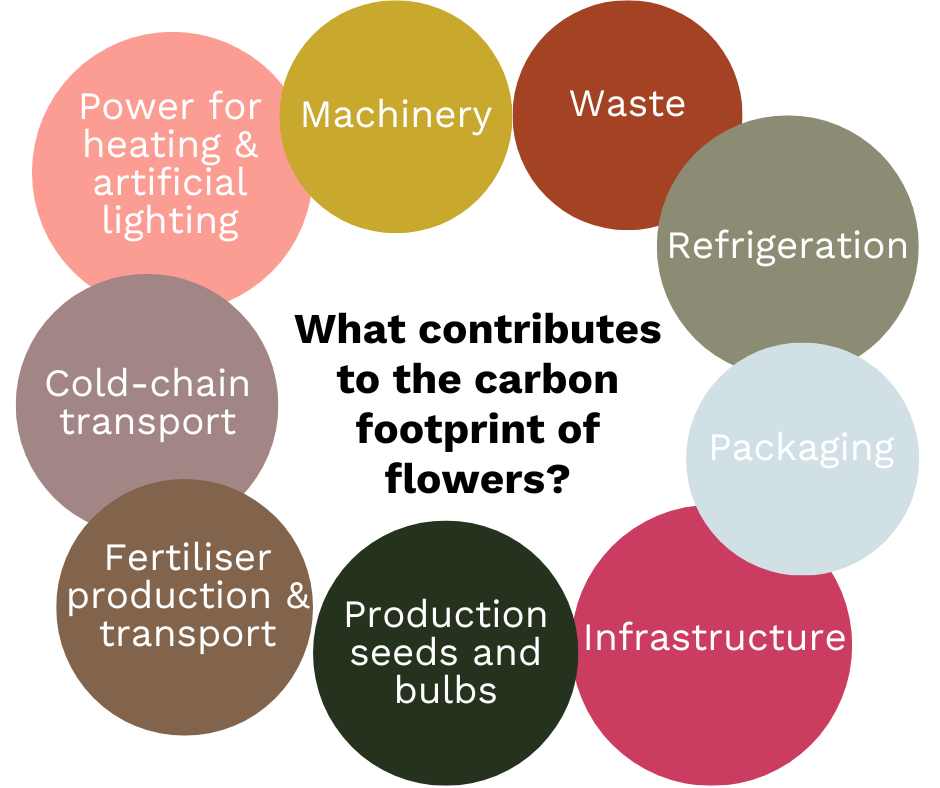
In the same way, we can calculate the carbon footprint of flowers. Depending on the flower, this could include the emissions from:
- the manufacture and transport fertilisers and pesticides
- glasshouse materials and manufacturing
- fuels for machinery and transport
- the energy to produce seedlings and bulbs
- the energy to manage waste and waste disposal.
We would also calculate the cost of artificially heating flowers in a glasshouse using systems powered by fossil fuels.
Then we’d include the emissions producing from burning fuel to power the cold-chain system including refrigeration and transport.
And then finally we’d include the end-of-life situation for flowers disposed in landfill where they would decompose and add even more methane gas to the atmosphere.
Research and the carbon footprints of flowers
The carbon footprint of flowers is something that has only recently come to the attention of researchers. Only a handful of studies have been conducted to directly calculate what these figures might be.
“I think it is fair to say that for a very long time, the carbon footprints of flower production wasn’t really considered or wasn’t really known,” explains Prof. David Bek from the Sustainable Cut Flowers Project UK.
“And it is only in the last three of four years where much work has been done to really try and create the numbers. But there is still an awful lot of understanding to be done.”
“But the problem is, flowers do have quite a significant impact, regardless of how they are produced on a commercial scale.”
Not all flowers are created equal
Much of our understanding about carbon footprints and horticulture also comes from studies on fruit and vegetables, which follow similar farming life-cycles.
From this body of knowledge, we understand the factors that contribute most to the carbon footprint of cut flowers are artificial heating using fossil fuels and long-distance air transport in a cold-chain system.
We also know that the smallest carbon footprints come from growing flowers seasonally in a field and transporting them short distances between the farm and place of retail sale.
One important study carried out in the UK showed that that carbon footprint of a mixed bunch of locally-grown, seasonal flowers can be just 10% of the footprint of a mixed bunch grown with artificial heating or transported by airfreight.
So the choice of variety, method of farming and location of the farm all contribute influence the footprint. In fact, farming flowers can even help to remove carbon from the atmosphere, and how they are farmed and transported.
For instance, over 20 stems of outdoor-grown snapdragon was found to have the same footprint as a single rose grown in hothouse in the Netherlands or airfreighted from Kenya.
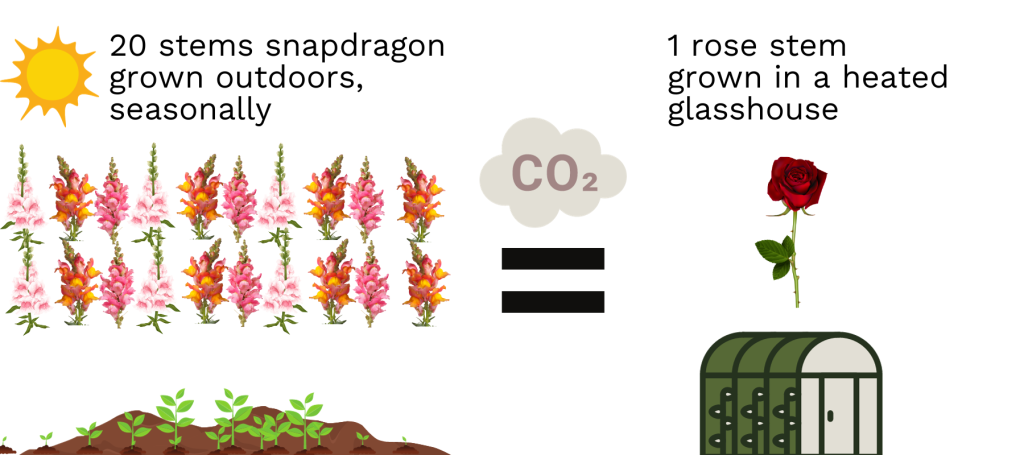
Data source: Swinn, R. (2017) A comparative LCA of the carbon footprint of cut-flowers: British, Dutch and Kenyan. Dissertation for MSc Environment & Development, Lancaster University
Because of their role in the global floriculture industry, roses have been given the most attention in carbon footprinting studies. Footprint calculations for a single rose have varied between these studies — some have put a single stem produced in a hothouse in the Netherlands at 1.8 kg per stem – to the 2.4 kg per stem example above.
But even through these figures differ, we can work with an approximate average to help understand carbon footprints, flowers and climate impact.
The footprints of people
As we mentioned earlier, footprints can be calculated for anything – a product, an action, an organisation, or a person. ‘Per capita emissions’ take a country’s total annual emissions and divide it by the population – creating an average footprint for each person in that country.
An average person in one country can have a different footprint to someone in another. This is not only a result of the average emissions from individual lifestyles led by that nation’s residents, but also how their country generates power and uses transport.
The carbon footprint of people considers how much fossil fuel they use through building and maintaining houses, getting around, and consuming and disposing of food and material objects like clothes, furniture, toys and machinery. The more stuff we accumulate and the more power we use, the higher our footprint. Obviously if one country averages at two cars per household, and in another country, not every household owns a car, then there will be a big difference in the emissions between households and individuals.
There is plenty of data that demonstrates the different footprint of different countries. The diagram below is a useful indicator of where countries sit with per capita CO2 emissions from burning fossil fuels and industry.

Data Source: https://ourworldindata.org/grapher/co-emissions-per-capita
As we can see, the range of footprints is as high as over 25 tonnes per person in the United Arab Emirates and is as low as 2 tonnes for someone living in India. There are large inequalities in the footprints of people across the world. Much of this is due to prosperity and lifestyle factors, but also the use of fossil fuels to generate electricity. Where renewables and nuclear power is used, per capita footprints are lowered – even though the living standards are similar.
But there is more to the emissions story
Per capita emissions are just one way of telling the story. Another way is to consider wealth and income. While the richest 10% in the world is responsible for an estimated 36-49% of the global emissions, the poorest, lowest-emitting 50% of the world’s population ranges from 7-15% of total emissions.
Then when we get to the very top of the income scale, lifestyle factors become the primary driver of climate impacts. As a result of luxurious lifestyles and excessive rates of consumption (large homes, private jets and yachts) the emissions of the top 1% highest income earners is greater than the total emissions of the bottom 50% combined — and it may be twice as high, according to some estimates.
It is easy to see how the carbon footprint of individuals in the top 1% might be far higher than any of the per-capita figures quoted here.
Personal carbon budget: 2.5 to stay alive
If we average the global footprint figures out, then the average global footprint is currently around 4.8 tonne per person.
This is where things start to get a bit shocking. To have the best chance of avoiding global warming of 1.5 degree C and the disastrous climate change associated with increases above this level, we need to slash those emissions down to a global average of 2.5 tonnes per person by 2030.
To achieve this, this biggest emitting countries will need to make enormous lifestyle and energy use changes. In developed countries, those changes will need come about the way we use and dispose of goods and consume things and the way we use transport and generate energy.
According to global footprinting expert Mike Berners-Lee in his book How Bad are Bananas?, a realistic goal for the average person in a developed country is 5 tonne per year. That includes all emissions associated with food production, consumption (stuff), transport and power. The following illustration, using data from How Bad are Bananas? gives a quick overview of the footprint associated with different things and actions.

A footprint in flowers – a case study
Now that we have a sense of how footprints might add up, we can see how carbon footprints may apply to floristry. The following case study illustrates how the carbon footprint of flowers compares to our carbon budgets goals.
The Florist’s Story:
“For this particular job, the client wanted a very specific ‘look’. This look worked in every way against my preferred, personal aesthetic – the theme was ‘racing car’ and the bridal party was to arrive in a red sports car.
Had I not just taken out a lease on a new studio, then I probably wouldn’t have done it. But I had bills to pay – and coming out of winter as a wedding and events florist, the income was much needed.
The couple insisted on arrangements of domed, long-stemmed red roses everywhere: bouquets, tall table vases, and big vases for the ceremony. It was September, the first month of spring in the Southern Hemisphere – at least a month before the seasonal roses would start.
I rang a local heated-glasshouse farm and they were thrilled to supply me with 25 buckets of long-stemmed bunches, given the low demand at the time. That was 2500 roses in total, at 60–70cm per bunch of ten stems. The job was done, the clients were thrilled, the grower was happy and I paid my rent.”
The footprint maths:
If we use an approximate figure of 2kg of CO2e per stem (lower than the 2.4kg quoted in the study) and multiply it by the 2500 stems used in the wedding, we see that the roses alone in that wedding equalled 5 tonnes of emissions.
That didn’t include the emissions associated with getting them there in the van, or running the fridge in the studio. Likewise, it didn’t include all the other emissions associated with the wedding, such as the food and beverages, the transport of guests and staff and power.
Looking at our rose example (and considering the annual target of 5 tonnes per person), we can see that the roses alone were equivalent to one person’s entire carbon budget for a whole year.

Roses grown in a heated glasshouse can carry a very high carbon footprint compared to outdoor grown seasonal flowers.

Weddings and events can require large volumes of the one type of flower.
Getting our floristry flower footprint down
So what can we do?
To lower our industry’s carbon footprint and support climate targets, we need to change the way we approach growing and selling flowers.
Growing
Shifting to renewable energy for heating and power and away from fossil fuels is a critical step in creating a more sustainable growing industry. Equally important is local support for and investment in low-emission growing methods – that is, outdoors, sun-powered and seasonal. Regenerative farming practices go one step further by improving soil and ecosystem health and sequestering carbon, and supporting farmers investing in sustainable growing systems is important for building a more sustainable industry overall.
Transport
We need to look at reducing the distance from grower to retailer, and avoiding the high emissions associated with air transport and the cold-chain system.
Florists
We need to promote locally-grown, seasonal and field-grown flowers wherever possible. When supplies are limited, we need to move to better imported options, such as flowers grown in heated glasshouses using renewable energy, flowers grown outdoors (or at least not grown in fossil-fuel heated conditions), and flowers transported using lower emission options, such as sea freight over air freight. At present, sea freight is more common between South and North America than between Africa-Europe, with only 4% of flowers transported by sea freight at present.
To find out what flowers satisfy these conditions, we need to ask questions of our wholesale suppliers.
We must also use our buying power, our knowledge of flowers and our creativity to help our customers find beauty in flower and foliage varieties with a low carbon footprint. A lower carbon flower industry can also be supported by:
- accepting the limitations of seasonal availability
- discourage out-of-season blooms/encourage weddings and events during peak flower season, particularly for roses/peonies
- using foliage and plants for a nature buzz when flowers are in short supply
- guiding consumers towards seasonal palettes and away from fashion-directed palettes
- demonstrate what seasonal designs can look like
- helping customers to understand why these choices are better
It is a big job. But every bunch counts. Customers want to know that their purchases are not contributing to climate change, and it is our job as florists to steer them in the right direction.
With thanks to SFN Expert Advisor Dr Angela Coulton for providing guidance and input in the creation of this resource.
For more information on carbon footprints, we recommend the book “How Bad are Bananas – The Carbon Footprint of Everything” by Mike Berners-Lee.
